Overview
Overview
Overview


Humidity is one of the most overlooked variables in hobby 3D printing. Filament absorbs moisture gradually, often causing stringing, weak layer adhesion, and failed prints long before the user realizes the environment is the problem. Most hobbyists rely on one-off weather checks or rough assumptions rather than consistent monitoring.
This project began as an interface exploration inspired by Bambu Studio’s device panel. Over time, it evolved into a full system that stores humidity data, visualizes trends, and ultimately receives real-time readings from a physical sensor placed beside my printer. The goal was to design not just a widget, but a believable monitoring tool that bridges interaction design and system architecture.
Phase One - Interface Concept
Phase One - Interface Concept


The first iteration focused purely on interface design. I created a Bambu Studio–inspired humidity widget that visually translated percentages into readable states such as Good, Okay, Fair, and Bad. The design emphasized clarity and low cognitive load, pairing a large numeric readout with status labeling and simple water-drop indicators.
The intention was to match Bambu’s functional minimalism. Flat surfaces, subtle contrast, and restrained color shifts kept the interface calm and technical. At this stage, humidity was treated as a snapshot in time, reinforcing the idea that the UI felt native to the slicer environment but lacked historical awareness.
Phase Two - Persistent Data System
Phase Two - Persistent Data System

The second phase introduced memory into the system. Instead of displaying isolated readings, the widget was connected to a Vercel backend and a MongoDB Atlas database. Each humidity check was logged with structured fields including value, state, source, and timestamp.
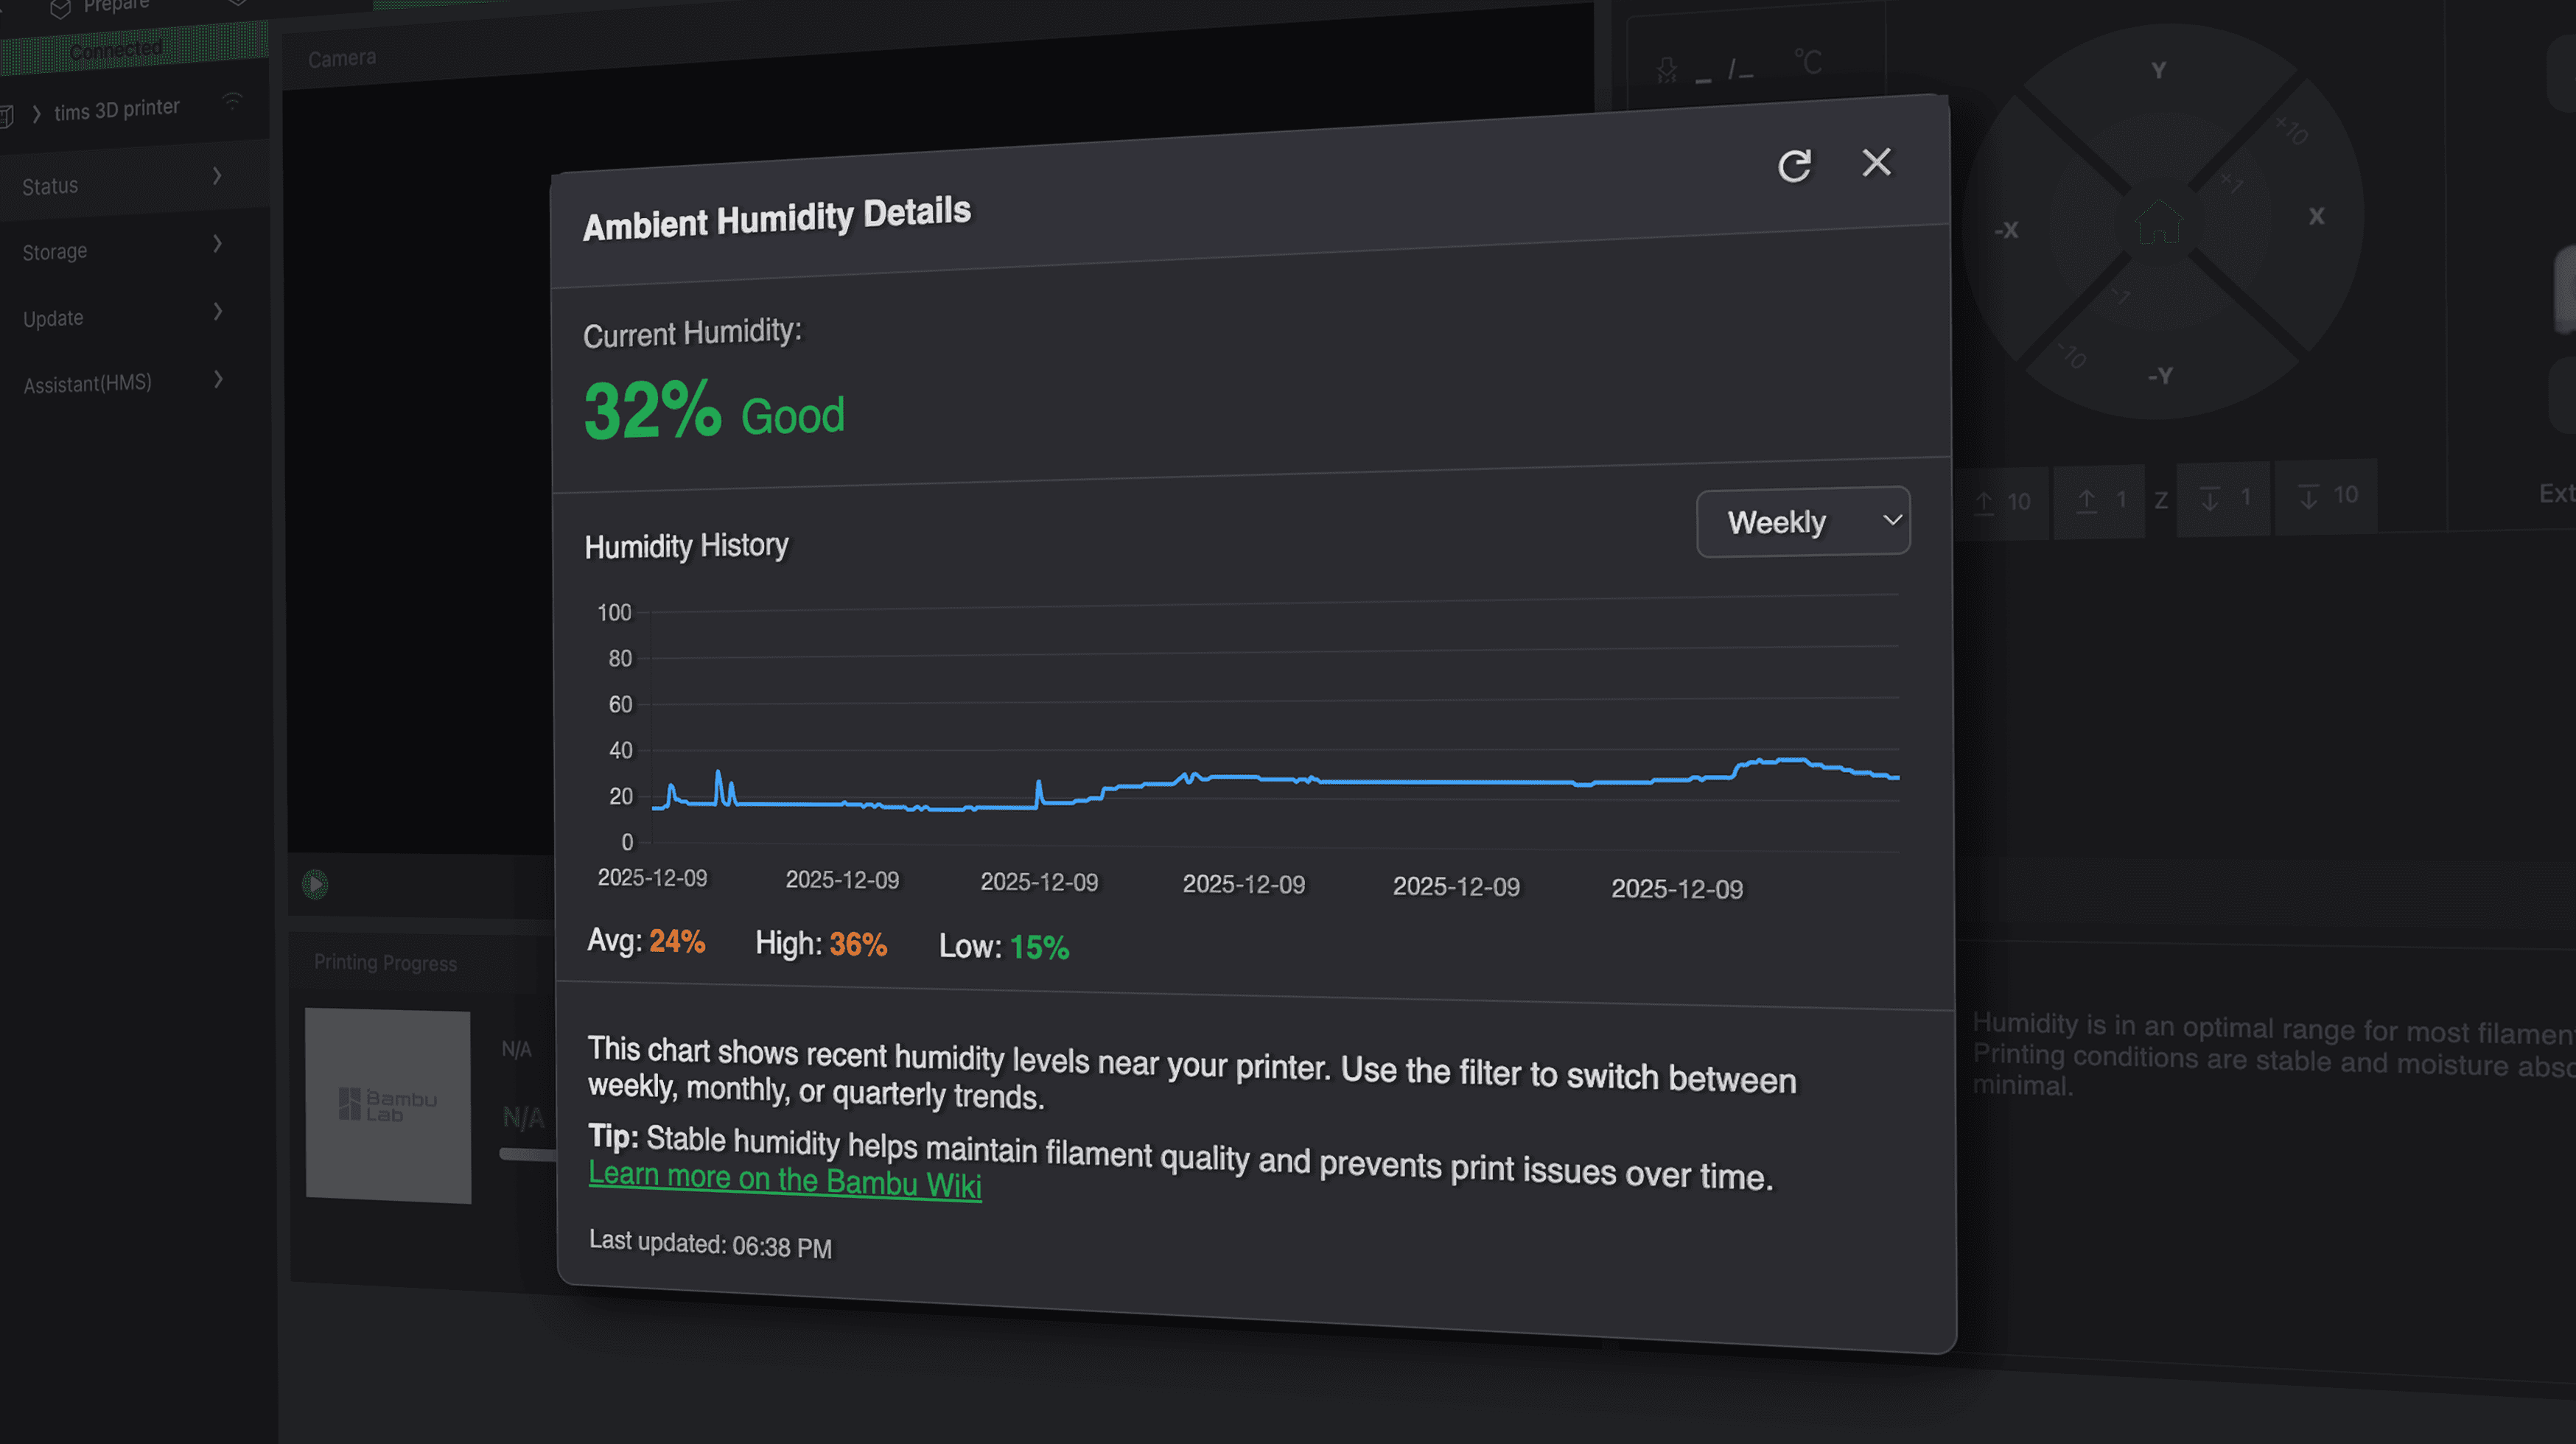
The interface remained visually simple, but now the “View More” modal revealed a history chart built with Chart.js. Users could filter recent readings and observe trends over time. Behind the scenes, the system followed full CRUD logic, creating records for new readings, reading recent entries for visualization, updating duplicates when necessary, and maintaining database cleanliness.
This phase shifted the project from a UI mockup into a working full-stack web application. It clarified how frontend interactions, API routes, and database logic connect to form a coherent system.
The second phase introduced memory into the system. Instead of displaying isolated readings, the widget was connected to a Vercel backend and a MongoDB Atlas database. Each humidity check was logged with structured fields including value, state, source, and timestamp.
The interface remained visually simple, but now the “View More” modal revealed a history chart built with Chart.js. Users could filter recent readings and observe trends over time. Behind the scenes, the system followed full CRUD logic, creating records for new readings, reading recent entries for visualization, updating duplicates when necessary, and maintaining database cleanliness.
This phase shifted the project from a UI mockup into a working full-stack web application. It clarified how frontend interactions, API routes, and database logic connect to form a coherent system.
Phase Three - Live Sensor Integration
Phase Three - Live Sensor Integration

The second phase introduced memory into the system. Instead of displaying isolated readings, the widget was connected to a Vercel backend and a MongoDB Atlas database. Each humidity check was logged with structured fields including value, state, source, and timestamp.
The interface remained visually simple, but now the “View More” modal revealed a history chart built with Chart.js. Users could filter recent readings and observe trends over time. Behind the scenes, the system followed full CRUD logic, creating records for new readings, reading recent entries for visualization, updating duplicates when necessary, and maintaining database cleanliness.
This phase shifted the project from a UI mockup into a working full-stack web application. It clarified how frontend interactions, API routes, and database logic connect to form a coherent system.

Interaction & Design Decisions
Interaction & Design Decisions

The widget uses state-based classification instead of raw percentages alone, reducing interpretation effort for users. Rather than forcing them to decide whether 52% humidity is acceptable, the interface translates values into meaningful guidance.
The modal pattern was chosen to preserve simplicity in the main panel while allowing deeper insight one level down. This mirrors Bambu Studio’s interaction model, maintaining credibility within the simulated environment.
For the final presentation, the widget was embedded into a static recreation of the Bambu Studio device screen. Instead of rebuilding the entire slicer UI in HTML and CSS, a high-fidelity screenshot was used as context, allowing the focus to remain on the live, functional component of the system.
Technical Architecture
Technical Architecture
Technical Architecture

The final system spans multiple layers. The frontend is built with HTML, CSS, and JavaScript, styled to match Bambu Studio’s visual language. Vercel serverless functions act as the backend layer, handling HTTP requests and database communication. MongoDB Atlas stores structured humidity logs. In the IoT phase, the ESP32 and DHT22 sensor extend the system into the physical world, sending live readings to the backend via Wi-Fi.
What began as a simple UI element ultimately became a multi-layered interaction system connecting hardware, cloud infrastructure, and interface design.

Project Reflection

This project reshaped how I think about interaction design. Rather than viewing interfaces as isolated visual exercises, I began to see them as the surface layer of deeper systems. APIs, databases, and physical sensors all influence how trustworthy and usable an interface feels.
Working through backend debugging, database structuring, and microcontroller programming forced me to understand how data flows across layers. The process strengthened both my technical confidence and my ability to design systems that are not only visually coherent, but structurally sound.
The Bambu Humidity Monitoring System now stands as a connected case study that demonstrates UI design, backend logic, and IoT integration working together as a unified experience.
Tim Ziaziulchyk
Interaction Designer & 3D Artist
© 2025 Tim Ziaziulchyk. All rights reserved.
Designed and built using Framer.

Book Cover Redesign
Conceptual book cover redesign translating abstract themes into a bold visual metaphor
Role: Visual Designer
Tools: Adobe Photoshop, Adobe Illustrator, Adobe Firefly, Procreate
Duration: 3 weeks